Gpu profiler
https://github.com/hongsulovey/android-gpu-profiler
Gpu profiler
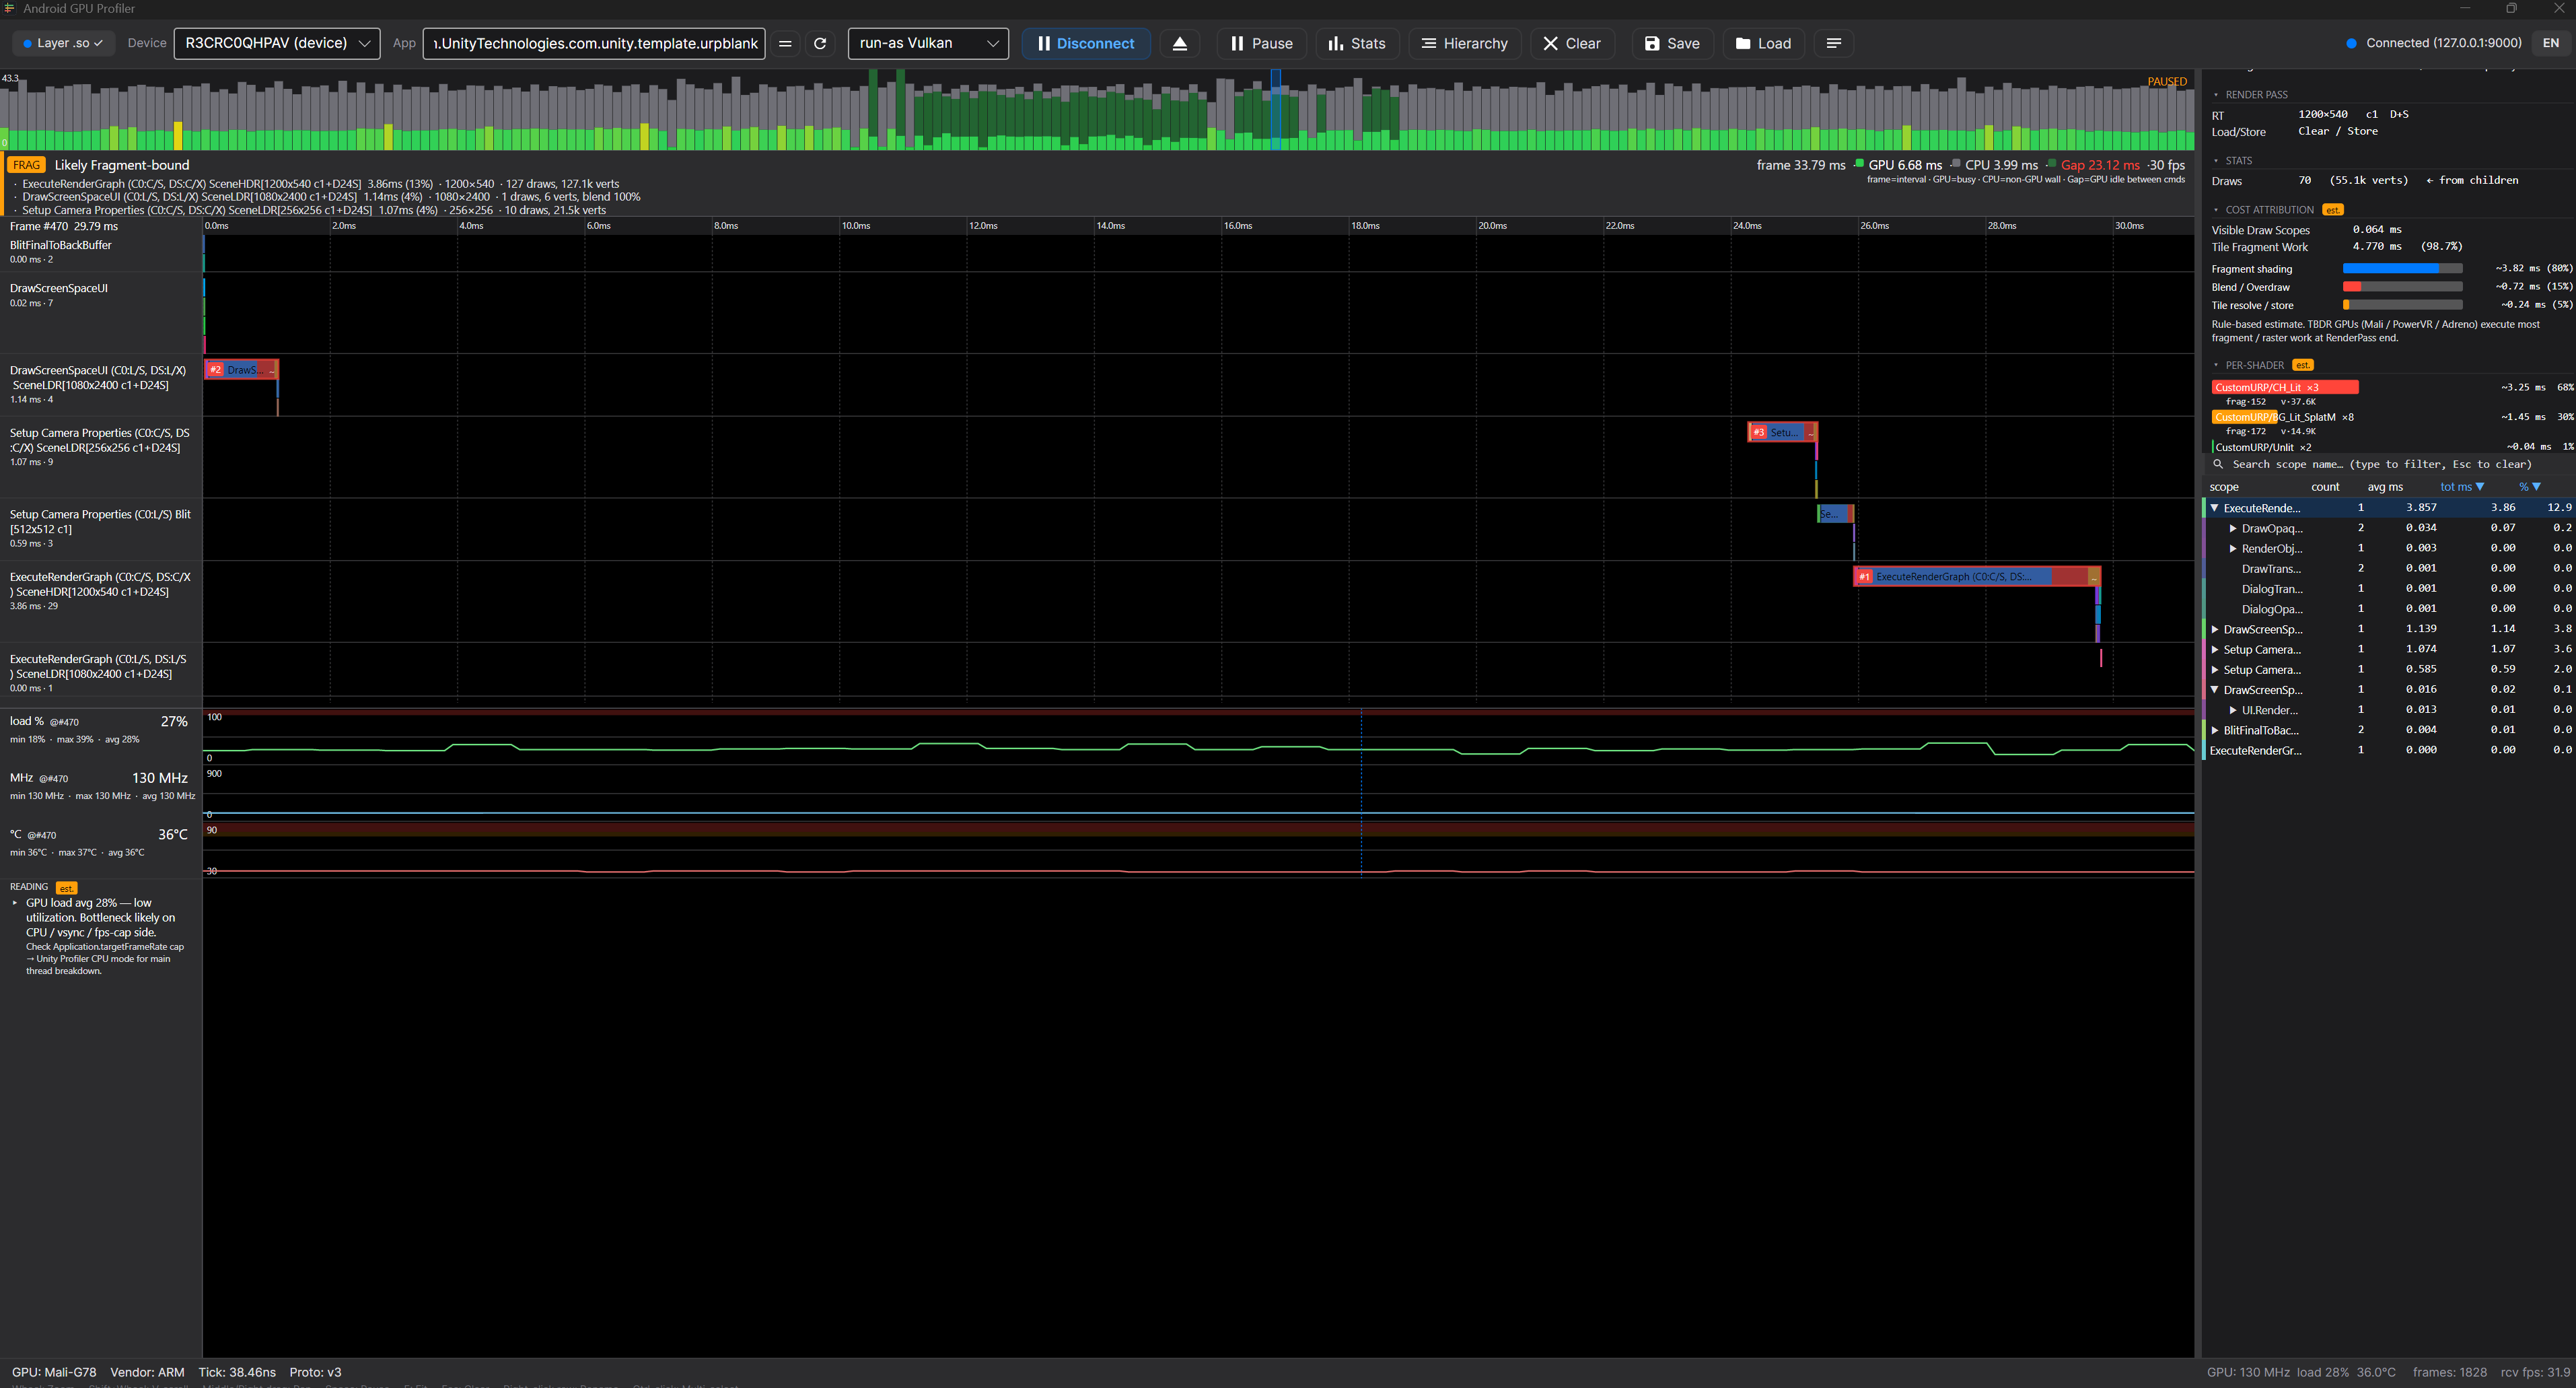
Android GPU Profiler#
A live-streaming GPU profiler that collects and analyzes GPU timing of Android Vulkan / GLES apps in real time.
Built to inspect per-frame GPU cost and bottlenecks via the Android GPU Layer mechanism, without modifying app source code.
Project Overview#
Android GPU Profiler is a personal R&D project for streaming GPU timing data of Vulkan / GLES apps running on Android devices to a PC in real time, and
visually analyzing per-frame GPU cost, RenderPass / Scope timings, and GPU load trends.
While RenderDoc and Android GPU Inspector focus on deep analysis of captured single frames,
this project focuses on observing the GPU state of a running app over time.
The goal is to quickly identify, during mobile game development, situations such as:
- Causes of frame spikes at specific moments
- GPU cost tracking for major segments: Opaque / Transparent / UI / Blit / Lighting
- Attach to Unity / Unreal / Native apps without source modifications
- On-device GPU timing collection via Vulkan / GLES layers
- Visualize bottlenecks through frame history and Scope timelines
Key Features#
Real-time GPU Timing Streaming#
Per-frame GPU timing data collected on the Android device is streamed to the PC Host app over TCP.
Instead of a single-frame capture, you can continuously observe frame history while the app runs.
Vulkan / GLES Layer-based Attach#
The profiler layer is injected into the target app using Android's GPU Debug Layer mechanism.
No app source modification is needed — any build with android:debuggable="true" can be attached externally.
Host GUI#
The PC Host app is built on .NET 8 + Avalonia.
Frame strip, Scope Gantt timeline, GPU Counter panel, and Bottleneck Banner let you spot bottlenecks quickly.
Bottleneck Classification#
Based on collected timing data, major frame bottlenecks are roughly classified:
- Fragment-bound
- Vertex-bound
- UI-bound
- Overdraw-heavy
- Blit / Resolve cost
- Lighting cost
- URP pattern estimation
Attach Automation#
Selecting a target package in the Host app automates the following:
- Layer APK installation
- Android GPU Debug Layer configuration
adb forwardsetup- Target app launch
- Configuration cleanup on Detach
Why I Built It#
In mobile game optimization, detailed analysis of a single frame matters, but
quickly understanding "why did that frame just spike?" during actual play is often more important.
RenderDoc and AGI are strong at deep single-frame analysis, but
for watching the full frame flow and seeing when and in which pass bottlenecks recur, they fell short.
This project was built to address that gap.
- I want to see on-device GPU spikes over time.
- I want to attach Unity URP / Unreal / Native apps without engine modifications.
- I want to see per-frame Scope cost in real time.
- I want likely bottleneck sections summarized automatically.
- I want a practical interpretation of mobile GPU pass costs, which are often ambiguous.
Tech Stack#
Native Layer#
- C++17
- Android NDK
- Vulkan Layer
- GLES Layer
- ARM64-v8a
- TCP Server
- GPU Timer Query
Host App#
- C#
- .NET 8
- Avalonia UI
- TCP Client
- Real-time timeline rendering
- Frame / Scope data visualization
Android#
- Android 9+
- Vulkan 1.1+
- GLES 3.0+
GL_EXT_disjoint_timer_query- ADB / Android Platform Tools